Compare and Contrast Type 1 and Type 2 diabetes: Activity 2.1.1 Diagnosing Diabetes
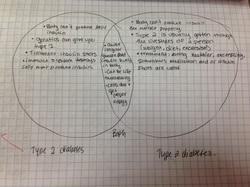
This venn diagram shows the comparison between type one and type two diabetes perfectly. It is a great way to organize the facts that I have come up with. It not only shows how they are different, but also shows clearly how they are alike. I think a venn diagram gives a good visual when you need to compare and contrast two different things, instead of lists or other graphic organizers.
These are all strengths of a venn diagram, but a possible weakness to this way of organizing material is that if you have a lot of information there might not be enough room to write it all in. Causing you to have to move it to a computer or having to make a second one, which would make it less organized.
Describe the structure of DNA including its specific monomers: Activity 1.2.1 What is DNA?
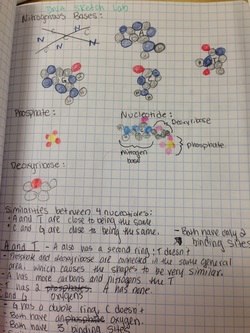
In this lab, we had to sketch the four nitrogenous bases, a phosphate, and a deoxyribose. These are all parts of the structure of DNA. After completing this lab I had a greater understanding of the structure and what it looked like. Using different colors to represent the different molecules I was able to clearly sketch out the different parts. This combined with putting a physical model together mastered my knowledge on the structure of DNA. One weakness of the drawings is that I am not the best artist, so the drawings are not an exact representation of the structures, but it got the point across. One strength is that drawing them out by myself helped me memorize how the structures looked.
In this lab, we had to sketch the four nitrogenous bases, a phosphate, and a deoxyribose. These are all parts of the structure of DNA. After completing this lab I had a greater understanding of the structure and what it looked like. Using different colors to represent the different molecules I was able to clearly sketch out the different parts. This combined with putting a physical model together mastered my knowledge on the structure of DNA. One weakness of the drawings is that I am not the best artist, so the drawings are not an exact representation of the structures, but it got the point across. One strength is that drawing them out by myself helped me memorize how the structures looked.

Digram the feedback relationship of blood glucose and the hormones insulin and glucagon: Activity 2.1.3 Feedback
This feedback map shows both the positive and negative feedbacks of the level of glucose and insulin in the body. It meets the criteria perfectly because it shows the relationship between glucose, insulin, and glucagon. This concept map helped me learn the steps the body takes to bring the blood glucose level back to equilibrium with the use of insulin and the storage of glucagon. A positive to this method is that it shows both the positive and negative feedbacks in an organized way, but a negative is that is it more like a note sheet. If you are not very familiar with diabetes this map may not have enough in depth information for a person to understand what happens.
This feedback map shows both the positive and negative feedbacks of the level of glucose and insulin in the body. It meets the criteria perfectly because it shows the relationship between glucose, insulin, and glucagon. This concept map helped me learn the steps the body takes to bring the blood glucose level back to equilibrium with the use of insulin and the storage of glucagon. A positive to this method is that it shows both the positive and negative feedbacks in an organized way, but a negative is that is it more like a note sheet. If you are not very familiar with diabetes this map may not have enough in depth information for a person to understand what happens.

Recognize that the structure of macromolecules is related to their functions in the human body: Activity 2.2.3 The Biochemistry of Food
Fats are stored in the body for energy needed at a later time. There are two types of fatty acids, saturated and unsaturated, both have long carbon chains, but unsaturated fats have one or more double bond in its chain. This double bond creates a kink in the chain. These long carbon chains are hard to break apart and are therefore good for storage. Unsaturated are easier to break down because the double bond has weakened the structure. Unsaturated fats are liquid at room temperature and are the healthier fat for our bodies. Fatty acids are also used as the structure of the cell membrane, which makes sense because of its strong carbon chain, and cell communication and bone structure. The long carbon chain is the unique characteristic to a fatty acid that helps explain it's roles in the body.
Fats are stored in the body for energy needed at a later time. There are two types of fatty acids, saturated and unsaturated, both have long carbon chains, but unsaturated fats have one or more double bond in its chain. This double bond creates a kink in the chain. These long carbon chains are hard to break apart and are therefore good for storage. Unsaturated are easier to break down because the double bond has weakened the structure. Unsaturated fats are liquid at room temperature and are the healthier fat for our bodies. Fatty acids are also used as the structure of the cell membrane, which makes sense because of its strong carbon chain, and cell communication and bone structure. The long carbon chain is the unique characteristic to a fatty acid that helps explain it's roles in the body.
Recognize that the regulation of blood sugar is necessary to avoid severe and life-threatening diabetic emergencies: Activity 2.3.3 Complications of Diabetes
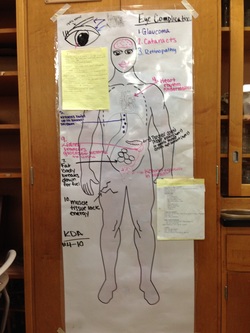
This body diagram showed the parts of the body that get affected by ketoacidosis (DKA). DKA is a severe side affect from diabetes that can cause death if not caught right away. It is found by looking at the blood/urine for Ketones. Some signs to look for are vomiting, thirst, peeing, high blood glucose, tired, difficulty breathing, fruity breath, and confusion. The doctor will test the urine with a test strip, if the strip reads that the glucose level is 240 mg/dL you should call a doctor right away. The persons diabetes are out of control. Some possible causes are not enough insulin, not enough food, and an insulin reaction. Seeing all of the bodies helped me to better understand the side effects diabetes can give a person.
This body diagram showed the parts of the body that get affected by ketoacidosis (DKA). DKA is a severe side affect from diabetes that can cause death if not caught right away. It is found by looking at the blood/urine for Ketones. Some signs to look for are vomiting, thirst, peeing, high blood glucose, tired, difficulty breathing, fruity breath, and confusion. The doctor will test the urine with a test strip, if the strip reads that the glucose level is 240 mg/dL you should call a doctor right away. The persons diabetes are out of control. Some possible causes are not enough insulin, not enough food, and an insulin reaction. Seeing all of the bodies helped me to better understand the side effects diabetes can give a person.
Compare Normal vs. Sickle-Shaped Red Blood Cells: Activity 3.1.1 Blood Detectives
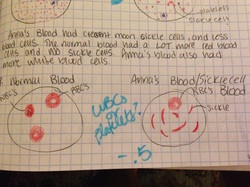
The sketches of the red blood cells from a normal blood and sickle cell blood meet the objective of comparing the two because they are an exact copy of what I saw under the microscope. It allows me to have a permeant visual of the differences. If you aren't specific with your drawings this may be a weak reference for the visual difference of normal blood cells compared to sickle cells. If the colors match and the drawings are very specific to what you drew it is a very strong reference. My drawings could have been a little better, but I gained a greater understanding of the difference between normal blood cells and sickle cells after I drew the pictures in my lab journal.
The sketches of the red blood cells from a normal blood and sickle cell blood meet the objective of comparing the two because they are an exact copy of what I saw under the microscope. It allows me to have a permeant visual of the differences. If you aren't specific with your drawings this may be a weak reference for the visual difference of normal blood cells compared to sickle cells. If the colors match and the drawings are very specific to what you drew it is a very strong reference. My drawings could have been a little better, but I gained a greater understanding of the difference between normal blood cells and sickle cells after I drew the pictures in my lab journal.
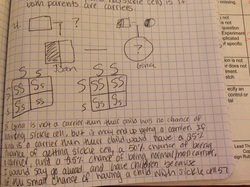
Explain how pedigrees can be used to determine the mode of inheritance of genetic diseases: Activity 3.4.2: What is the Probability?
This lab prepared me to answer this conclusion question by showing me how to use a pedigree and punnett squares to find the inheritance of a gene. I was able to use the information the conclusion question four gave me about Juan's family. I drew a pedigree and some punnett squares to help me figure out what the probability their child has of getting sickle cell disease. The pedigree is a very strong artifact to help you map out a families traits. In this case it helped me conclude that their child would have a very small chance of getting sickle cell. This process is what genetic councilors use to help guide couples in their decision making on having children.
This lab prepared me to answer this conclusion question by showing me how to use a pedigree and punnett squares to find the inheritance of a gene. I was able to use the information the conclusion question four gave me about Juan's family. I drew a pedigree and some punnett squares to help me figure out what the probability their child has of getting sickle cell disease. The pedigree is a very strong artifact to help you map out a families traits. In this case it helped me conclude that their child would have a very small chance of getting sickle cell. This process is what genetic councilors use to help guide couples in their decision making on having children.
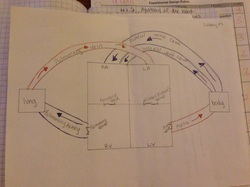
Outline the path of the major blood vessels to and from the heart: Activity 4.1.1 Path of Blood in the Heart
This heart box meets the criteria of outlining the path of major blood vessels to and from the heart because it has arrows indicating the direction of the blood and colors that indicate if the blood is oxygenated or not. This heart box helped me A LOT when I was learning and memorizing the blood flow through the heart. I think it is a very strong artifact because it is easy to follow and a great study tool. It allowed me to successfully number the path of blood flow on the test, and if asked I would be able to answer any question about the blood flow through the heart and where it goes. The heart box is a great academic learning tool for a visual leaner like myself.
This heart box meets the criteria of outlining the path of major blood vessels to and from the heart because it has arrows indicating the direction of the blood and colors that indicate if the blood is oxygenated or not. This heart box helped me A LOT when I was learning and memorizing the blood flow through the heart. I think it is a very strong artifact because it is easy to follow and a great study tool. It allowed me to successfully number the path of blood flow on the test, and if asked I would be able to answer any question about the blood flow through the heart and where it goes. The heart box is a great academic learning tool for a visual leaner like myself.

Describe how cholesterol buildup can impact blood flow through arteries: Activity 4.3.1 What is cholesterol?
These notes that we took during the beginning of activity 4.3.1 were very helpful. They educated us on what the difference between HDL and LDL are and how complications can affect our arteries. This artifact is very strong because of the pictures that went along with it to gives a visual that HDL carriers cholesterol away from the arteries to the liver to be filtered and LDL dumps cholesterol in the arteries. If a person had low levels of HDL the body wouldn't be able to keep up and take the cholesterol to the liver, which would cause a buildup in the arteries. This ultimately could cause a heart attack because of the lack of blood flow to the heart. This artifact helped me understand what the "good" cholesterol was. I previously didn't know, but it also taught me that you need both in order to maintain homeostasis.
These notes that we took during the beginning of activity 4.3.1 were very helpful. They educated us on what the difference between HDL and LDL are and how complications can affect our arteries. This artifact is very strong because of the pictures that went along with it to gives a visual that HDL carriers cholesterol away from the arteries to the liver to be filtered and LDL dumps cholesterol in the arteries. If a person had low levels of HDL the body wouldn't be able to keep up and take the cholesterol to the liver, which would cause a buildup in the arteries. This ultimately could cause a heart attack because of the lack of blood flow to the heart. This artifact helped me understand what the "good" cholesterol was. I previously didn't know, but it also taught me that you need both in order to maintain homeostasis.
